Deep Dive into the Internet: The Anatomy of Network Diagnostics with ICMP, Ping, and MTR
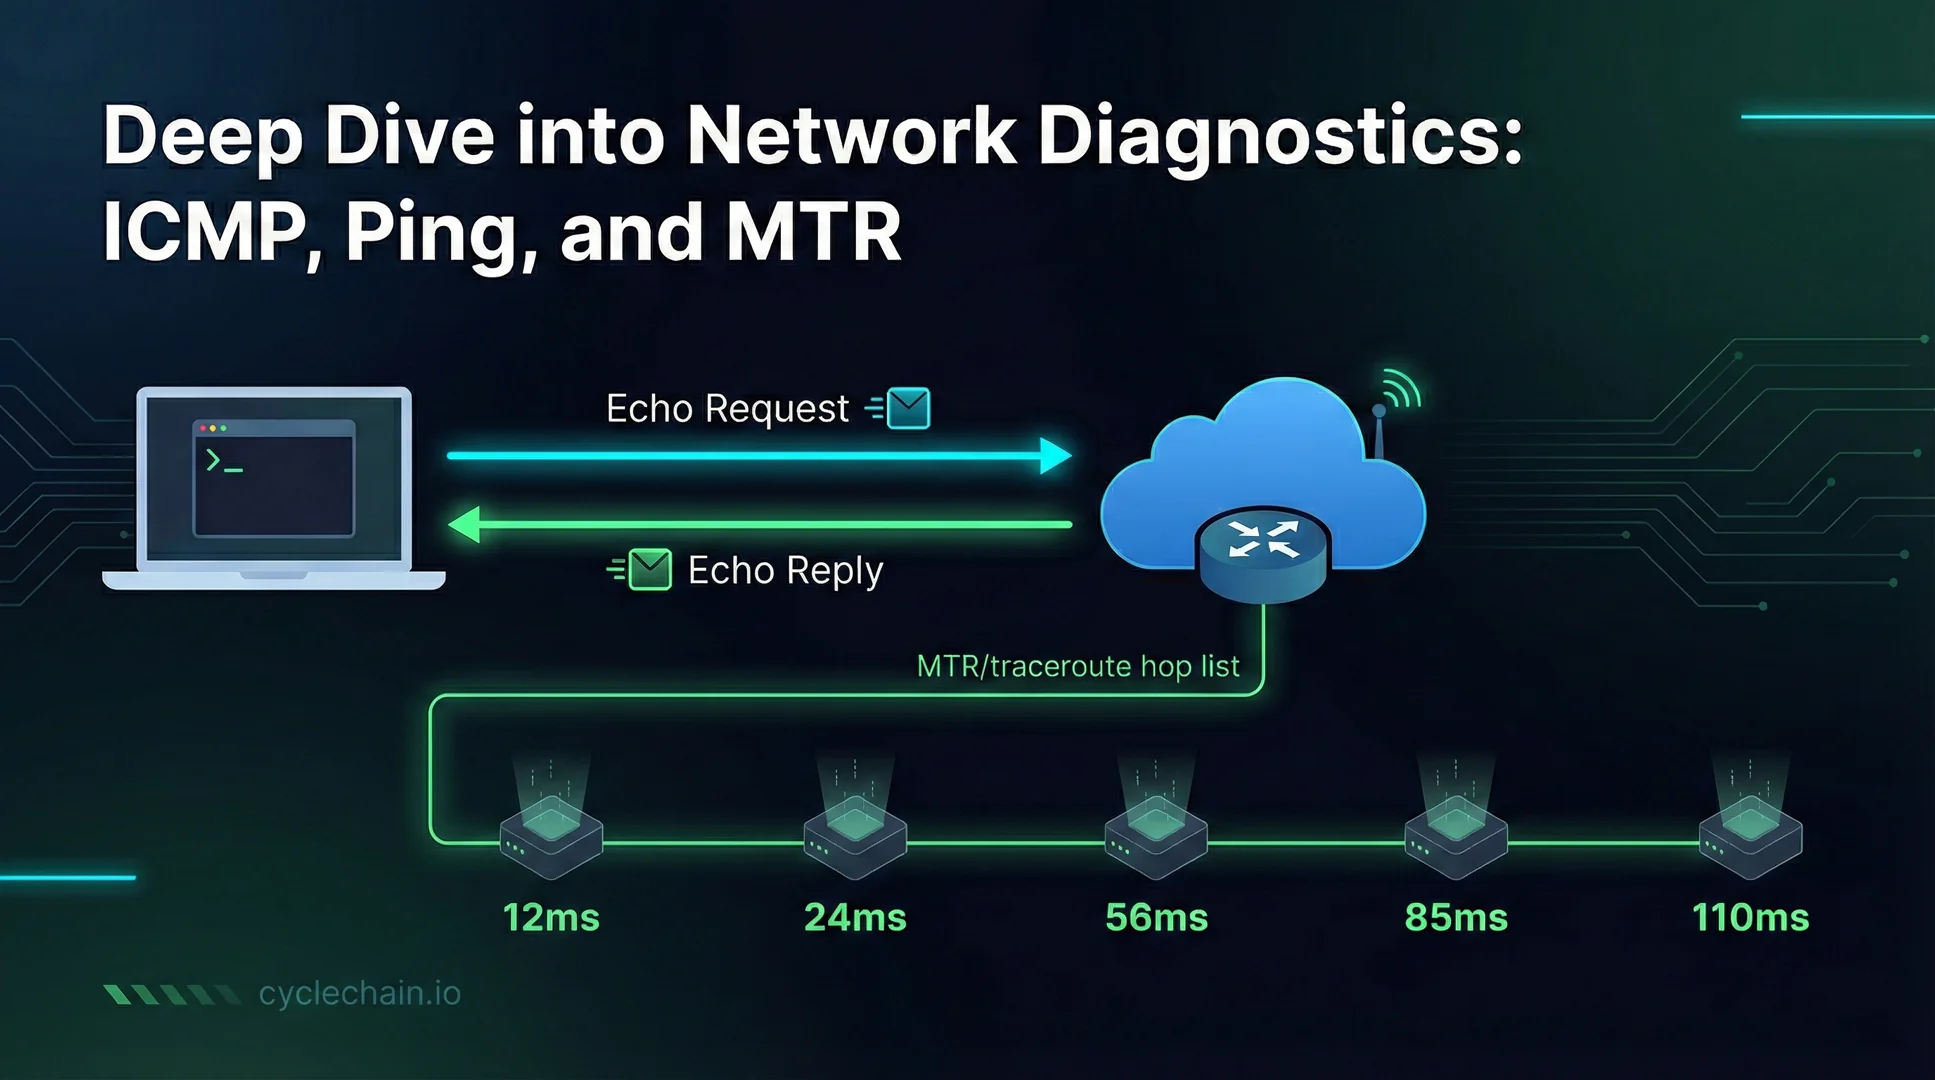
Deep dive into network diagnostics with ICMP, Ping, and MTR (created by Gemini 3.0)
Table of Contents
Introduction #
When we talk about the Internet, it’s so important that saying “it’s used like this, it’s a must-have” would sound too simple. We’ll take a look at how the magic behind the internet actually works. What’s happening in the background when you visit a webpage, send a message, or watch a video?
In this guide, we’ll take a journey from the basics of the internet towards the most important building blocks of network diagnostic tools. We’ll examine the ICMP protocol, ping command, and advanced network diagnostics tool MTR in depth. We’re looking under the hood.
History and Evolution of the Internet #
ARPANET: Where It All Started (1969) #
The story of the internet begins in the late 1960s during the Cold War era. The Advanced Research Projects Agency (ARPA) unit of the US Department of Defense wanted to develop a communication network that could withstand a nuclear attack.
Core Design Philosophy:
- Decentralized Structure: There was no single point of control
- Packet Switching: The revolutionary idea of Paul Baran and Donald Davies
- Redundancy: If one connection broke, there should be alternative paths
On October 29, 1969, the first message was sent from UCLA to Stanford Research Institute. The first word to be transmitted was supposed to be “LOGIN”, but the system crashed after the letters “LO” - one of history’s most meaningful system crashes :D
Birth of TCP/IP (1970s) #
1974: Vint Cerf and Bob Kahn started working on “Transmission Control Protocol” (TCP).
Main Problem: How will different networks talk to each other?
- Different hardware
- Different protocols
- Different error management strategies
Solution: A universal protocol layer - TCP/IP
1983: ARPANET switched from NCP protocol to TCP/IP. This date is called “Flag Day” and is considered the birth date of the modern internet.
Expansion of the Internet (1980-1990s) #
- 1984: Domain Name System (DNS) went live
- 1989: Tim Berners-Lee invented the World Wide Web (WWW)
- 1991: Internet opened to the public
- 1995-2000: Dot-com boom and mass adoption of the internet
How Does the Internet Work? Down the Rabbit Hole #
Packet Switching: The Foundation of Internet #
Traditional telephone systems had “circuit switching” - a dedicated line was established between caller and called. The Internet works differently though.
How Does Packet Switching Work?
Original Data: "Hello World!"
↓
Split into Packets:
[Packet 1: "Hell"] [Packet 2: "o Wo"] [Packet 3: "rld!"]
↓
Each packet is routed independently
↓
Reassembled at destination
ASCII Diagram
+------------------------------------------------------------------+
|                      SENDER (SOURCE)                             |
|                 Data: "Hello World!"                             |
+------------------------------------------------------------------+
                            |
                            v
                    1. SEGMENTATION
            -------------------------------------
            |           |           |           |
         [Hell]      [o Wo]      [rld!]
        (Packet 1)   (Packet 2)   (Packet 3)
            |           |           |
            v           v           v
  ~~~~~~~~~~~~~~~~~~~~~~~~~~~~~~~~~~~~~~~~~~~~~~~~~~~~~~~~~~~~
  ~                   INTERNET CLOUD (NETWORK)                ~
  ~~~~~~~~~~~~~~~~~~~~~~~~~~~~~~~~~~~~~~~~~~~~~~~~~~~~~~~~~~~~
            |           |           |
        +-------+   +-------+   +-------+
        |Router |   |Router |   |Router |
        |   A   |   |   B   |   |   C   |
        +-------+   +-------+   +-------+
            |           |           |
            |     (Path Blocked)    |
            |           X           |
            v           |           v
        +-------+       -------->+-------+
        |Router |                |Router |
        |   E   |                |   F   |
        +-------+                +-------+
            |                        |
            v                        v
         [Hell]                   [o Wo]
                                  [rld!]
  ~~~~~~~~~~~~~~~~~~~~~~~~~~~~~~~~~~~~~~~~~~~~~~~~~~~~~~~~~~~~
            |           |            |
            v           v            v
         (Packet 1)   (Packet 3)    (Packet 2)
            * Note: Packets can arrive out of order! *
            |           |            |
            --------------------------------------
                            |
                            v
                 2. REASSEMBLY
         (TCP protocol arranges packets in correct order)
                            |
                            v
            [Hell] + [o Wo] + [rld!]
                            |
                            v
+------------------------------------------------------------------+
|                        RECEIVER (DESTINATION)                    |
|                 Result: "Hello World!"                           |
+------------------------------------------------------------------+
Advantages:
- Flexibility: If one path is blocked, it goes through another
- Efficiency: Bandwidth is shared
- Reliability: A single failure doesn’t crash the entire system
⚙️ Simulation Code Example
import time
import random

# --- GLOBAL VARIABLES ---
receiver_buffer = []
MY_IP_ADDRESS = "192.168.1.10"

# --- STEP 1: SENDER ---
def send_data(original_data, destination_address):
    print(f"\n--- [SENDER] Original Data: '{original_data}' ---")
    print(f"--- [SENDER] Data is being split and sent to network...\n")

    # Split data into 4-character chunks
    chunks = [original_data[i:i+4] for i in range(0, len(original_data), 4)]

    packet_list = []
    total_packets_count = len(chunks)

    for index, chunk in enumerate(chunks):
        packet = {
            "payload": chunk,              # THIS IS THE PART WE'LL PRINT
            "sequence_id": index,
            "total_count": total_packets_count,
            "destination": destination_address,
            "source": MY_IP_ADDRESS
        }
        packet_list.append(packet)

    # Shuffle packet order (Internet simulation)
    random.shuffle(packet_list)

    for packet in packet_list:
        route_packet(packet)


# --- STEP 2: NETWORK ROUTER ---
def route_packet(packet):
    available_paths = ["Fiber_Line_A", "Satellite_Link_B", "Copper_Cable_C"]
    best_path = random.choice(available_paths)

    # UPDATE HERE:
    # We print both Packet ID and its content (Payload).
    # Used alignment in f-string (<20 etc.) so output looks neat.

    payload_content = f"'{packet['payload']}'"

    print(f" -> [ROUTER] Packet ID: {packet['sequence_id']} | "
          f"CONTENT: {payload_content:<10} | "  # Shows and aligns data
          f"PATH: {best_path}")

    time.sleep(0.5) # Wait half a second to see the process
    receive_data(packet)


# --- STEP 3: RECEIVER ---
def receive_data(incoming_packet):
    global receiver_buffer
    receiver_buffer.append(incoming_packet)

    if len(receiver_buffer) == incoming_packet['total_count']:
        print("\n--- [RECEIVER] All parts received! ---")

        # Sort
        sorted_packets = sorted(receiver_buffer, key=lambda x: x['sequence_id'])

        # Reassemble
        final_message = ""
        print("--- [RECEIVER] Packets Being Sorted and Reassembled: ---")

        for p in sorted_packets:
            print(f"    + Packet {p['sequence_id']} added: '{p['payload']}'")
            final_message += p['payload']

        print(f"\nRESULT: Message Successfully Received -> '{final_message}'")

        receiver_buffer = []

# --- RUN THE APPLICATION ---
if __name__ == "__main__":
    message = "Hello World! How are you?"
    target = "10.0.0.5"

    send_data(message, target)
TCP/IP Model: 4-Layer Architecture #
The Internet is built on a layered architecture. Each layer serves the layer above it and uses the services of the layer below.
┌─────────────────────────────────────┐
│   4. Application Layer              │
│   (HTTP, FTP, SMTP, DNS)            │
├─────────────────────────────────────┤
│   3. Transport Layer                │
│   (TCP, UDP)                        │
├─────────────────────────────────────┤
│   2. Internet Layer                 │
│   (IP, ICMP, IGMP)                  │
├─────────────────────────────────────┤
│   1. Network Interface Layer        │
│   (Ethernet, Wi-Fi)                 │
└─────────────────────────────────────┘
1. Network Interface Layer (Link Layer) #
- Task: Data transmission over physical network
- Technologies: Ethernet, Wi-Fi, Fiber optic
- MAC Address: Physical hardware address (e.g.,
00:1B:44:11:3A:B7)
2. Internet Layer #
- Task: Routing of packets
- Main Protocol: IP (Internet Protocol)
- ICMP: Works at this layer! (Control and error messages)
IP Address Structure:
IPv4: 192.168.1.100 (32-bit, ~4.3 billion addresses)
      [Network Part].[Host Part]

IPv6: 2001:0db8:85a3:0000:0000:8a2e:0370:7334 (128-bit, ~340 undecillion addresses)
3. Transport Layer #
- TCP: Reliable, ordered, error-free transmission (e.g., web pages, email)
- UDP: Fast but unreliable transmission (e.g., video streaming, DNS)
TCP vs UDP:
TCP: If packet is lost, resend it, ordering guaranteed
     [SYN] → [SYN-ACK] → [ACK] (Three-way handshake)
     Slow but reliable

UDP: Send packet and forget. If it's lost, it's lost
     Fast but unreliable
Note #
- SYN (Synchronize): The “Shall we establish a connection?” request sent by the side initiating communication.
- ACK (Acknowledgment): The “OK, I received it” confirmation that verifies the previous message was received without problems.
- SYN-ACK: The server’s way of saying “I received your request (ACK) and I’m ready too (SYN)”.
4. Application Layer #
- HTTP/HTTPS: Web
- SMTP/POP3/IMAP: Email
- FTP: File transfer
- DNS: Domain name resolution
- SSH: Secure remote connection
Routing: How Do Packets Find Their Way? #
Each router keeps a “routing table”:
$ ip route show
default via 192.168.1.1 dev eth0
192.168.1.0/24 dev eth0 proto kernel scope link src 192.168.1.100
| OS | Status / Required Package | Equivalent |
|---|---|---|
| Linux | iproute2 (Usually comes pre-installed) | ip route show |
| Windows | Native command (CMD / PowerShell) | route print |
| macOS | Native command (or brew install iproute2mac) | netstat -rn |
Routing Process:
- Packet arrives at router
- Router looks at destination IP address
- Selects most suitable path from routing table
- Sends packet to next hop (next router)
- This process repeats until destination is reached
Example Journey:
Istanbul → Frankfurt → London → New York

Your computer in Istanbul:
  ↓ (Send packet: destination 93.184.216.34)
Internet Service Provider (ISP) Router
  ↓ (Best route: Frankfurt)
Frankfurt Backbone Router
  ↓ (Through Atlantic cable)
New York Router
  ↓
Destination Server (93.184.216.34)
Each router only knows the next step - not the entire path. This “distributed intelligence” approach is the key to internet scalability.
What is Distributed Intelligence?
ICMP Protocol: The Nervous System of the Internet #
What is ICMP? #
Internet Control Message Protocol (ICMP) is part of the IP protocol but serves a different purpose:
- Doesn’t carry data
- Transmits error notifications
- Sends network diagnostic messages
History: Defined by RFC 792 (1981) - by Jon Postel
Why is ICMP Needed? #
IP protocol works with “best-effort” principle:
- Doesn’t guarantee packet delivery
- Doesn’t report errors
- Doesn’t provide flow control
ICMP fills this gap!
ICMP Message Structure #
 0                   1                   2                   3
 0 1 2 3 4 5 6 7 8 9 0 1 2 3 4 5 6 7 8 9 0 1 2 3 4 5 6 7 8 9 0 1
+-+-+-+-+-+-+-+-+-+-+-+-+-+-+-+-+-+-+-+-+-+-+-+-+-+-+-+-+-+-+-+-+
|     Type      |     Code      |          Checksum             |
+-+-+-+-+-+-+-+-+-+-+-+-+-+-+-+-+-+-+-+-+-+-+-+-+-+-+-+-+-+-+-+-+
|                         Rest of Header                        |
+-+-+-+-+-+-+-+-+-+-+-+-+-+-+-+-+-+-+-+-+-+-+-+-+-+-+-+-+-+-+-+-+
|                         Data Section                          |
+-+-+-+-+-+-+-+-+-+-+-+-+-+-+-+-+-+-+-+-+-+-+-+-+-+-+-+-+-+-+-+-+
All ICMP Message Types
The table below is for ICMPv4 (RFC792 / IANA ICMP Parameters), showing all Types and assigned Codes (if any). (Some Types are Deprecated / Unassigned / Reserved so not used in practice.) (IANA)
| Type | Code | Message Name | Description and Usage Scenario |
|---|---|---|---|
| 0 | 0 | Echo Reply | “I’m here!” response. Returns in response to ping request. (IANA) |
| 1 | - | Unassigned | No ICMP type assigned in IANA. Not used in practice. (IANA) |
| 2 | - | Unassigned | No ICMP type assigned in IANA. Not used in practice. (IANA) |
| 3 | 0 | Network Unreachable | No route to destination network (no route in router / no default route etc.). (IANA) |
| 3 | 1 | Host Unreachable | Network exists but can’t reach destination host (ARP can’t resolve, host down, L2/L3 problem). (IANA) |
| 3 | 2 | Protocol Unreachable | Target system doesn’t support specified upper protocol (e.g., IP payload protocol field). (IANA) |
| 3 | 3 | Port Unreachable | Target host is up but relevant UDP/TCP port is closed / service not listening (typical for UDP). (IANA) |
| 3 | 4 | Fragmentation Needed (DF set) | MTU small, packet needs fragmentation but can’t fragment because DF is set (PMTUD scenario). (IANA) |
| 3 | 5 | Source Route Failed | Source routing option couldn’t follow requested route / failed. (IANA) |
| 3 | 6 | Destination Network Unknown | “Network unknown” more specific unreachable (defined with RFC1122). (IANA) |
| 3 | 7 | Destination Host Unknown | “Host unknown” (RFC1122). Not DNS; means “undefined” in routing/reachability sense. (IANA) |
| 3 | 8 | Source Host Isolated | Source host isolated (historical/legacy; rare today). (IANA) |
| 3 | 9 | Network Administratively Prohibited | Access to destination network administratively blocked (ACL/policy). (IANA) |
| 3 | 10 | Host Administratively Prohibited | Access to destination host administratively blocked (ACL/policy). (IANA) |
| 3 | 11 | Network Unreachable for ToS | Can’t reach destination network due to Type of Service (ToS) (legacy). (IANA) |
| 3 | 12 | Host Unreachable for ToS | Can’t reach destination host due to ToS (legacy). (IANA) |
| 3 | 13 | Communication Administratively Prohibited | Communication blocked in general due to “policy/filter” (RFC1812). (IANA) |
| 3 | 14 | Host Precedence Violation | Precedence/priority violation (policy). Rare/legacy. (IANA) |
| 3 | 15 | Precedence Cutoff in Effect | Precedence cutoff active; packet priority insufficient (legacy). (IANA) |
| 4 | 0 | Source Quench (Deprecated) | Old “congestion slow down” message. Use not recommended/deprecated. (IANA) |
| 5 | 0 | Redirect (Network/Subnet) | Router: “For this network, don’t go through me, go through this gateway.” (better next-hop within same LAN). (IANA) |
| 5 | 1 | Redirect (Host) | Router: “For this host, don’t go through me, go through this gateway.” (IANA) |
| 5 | 2 | Redirect (ToS + Network) | Redirect for network based on ToS (legacy). (IANA) |
| 5 | 3 | Redirect (ToS + Host) | Redirect for host based on ToS (legacy). (IANA) |
| 6 | 0 | Alternate Host Address (Deprecated) | “Alternative address for host” announcement (historical; deprecated). (IANA) |
| 7 | - | Unassigned | No ICMP type assigned in IANA. (IANA) |
| 8 | 0 | Echo Request | “Are you there?” message. Request sent by ping command. (IANA) |
| 9 | 0 | Router Advertisement (Normal) | Router discovery/announcement (ICMP Router Discovery). For gateway discovery in some networks. (IANA) |
| 9 | 16 | Router Advertisement (Not route common traffic) | Router announcement marked as “Don’t route general traffic” (Mobile IP context). (IANA) |
| 10 | 0 | Router Solicitation | Client: “Routers announce yourselves” solicitation (router discovery). (IANA) |
| 11 | 0 | TTL Exceeded (Transit) | Heart of Traceroute. TTL expired in transit, router drops packet and returns this error. (IANA) |
| 11 | 1 | Fragment Reassembly Time Exceeded | Fragmented packet pieces didn’t arrive in time; reassembly timeout. (IANA) |
| 12 | 0 | Parameter Problem (Pointer) | A field in IP header is incorrect; pointer shows which byte has the error (header corrupted/unsuitable). (IANA) |
| 12 | 1 | Parameter Problem (Missing Option) | Required IP option missing. (Legacy/option scenario.) (IANA) |
| 12 | 2 | Parameter Problem (Bad Length) | Header length/field length incorrect. (Packet format problem.) (IANA) |
| 13 | 0 | Timestamp | Timestamp request for time measurement/round-trip and clock sync tests (rare today). (IANA) |
| 14 | 0 | Timestamp Reply | Response to timestamp request. (IANA) |
| 15 | 0 | Information Request (Deprecated) | Old information request; deprecated. (IANA) |
| 16 | 0 | Information Reply (Deprecated) | Old information reply; deprecated. (IANA) |
| 17 | 0 | Address Mask Request (Deprecated) | Request to learn subnet mask (legacy; deprecated). (IANA) |
| 18 | 0 | Address Mask Reply (Deprecated) | Response to address mask request (legacy; deprecated). (IANA) |
| 19 | - | Reserved (for Security) | “Reserved” for security purposes; not used. (IANA) |
| 20-29 | - | Reserved (Robustness Experiment) | Range reserved for robustness experiments; not used in practice. (IANA) |
| 30 | - | Traceroute (Deprecated) | ICMP “Traceroute” type historically exists but deprecated; modern traceroute usually works with Type 11/3. (IANA) |
| 31 | - | Datagram Conversion Error (Deprecated) | Datagram conversion error; deprecated/legacy. (IANA) |
| 32 | - | Mobile Host Redirect (Deprecated) | Redirect in Mobile IP context; deprecated/legacy. (IANA) |
| 33 | - | IPv6 Where-Are-You (Deprecated) | Historical/legacy type within ICMPv4; deprecated. (Don’t confuse with ICMPv6.) (IANA) |
| 34 | - | IPv6 I-Am-Here (Deprecated) | Similarly legacy; deprecated. (IANA) |
| 35 | - | Mobile Registration Request (Deprecated) | Mobile registration request; deprecated. (IANA) |
| 36 | - | Mobile Registration Reply (Deprecated) | Mobile registration reply; deprecated. (IANA) |
| 37 | - | Domain Name Request (Deprecated) | Domain name query via ICMP (legacy/deprecated). (IANA) |
| 38 | - | Domain Name Reply (Deprecated) | Response to domain name query (legacy/deprecated). (IANA) |
| 39 | - | SKIP (Deprecated) | Historical type related to SKIP key management; deprecated. (IANA) |
| 40 | 0 | Photuris: Bad SPI | Photuris/IPsec key management error notification: SPI incorrect. (IANA) |
| 40 | 1 | Photuris: Authentication Failed | Photuris authentication failed. (IANA) |
| 40 | 2 | Photuris: Decompression Failed | Photuris decompression failed. (IANA) |
| 40 | 3 | Photuris: Decryption Failed | Photuris decryption failed. (IANA) |
| 40 | 4 | Photuris: Need Authentication | Photuris: Authentication required. (IANA) |
| 40 | 5 | Photuris: Need Authorization | Photuris: Authorization required. (IANA) |
| 41 | - | Experimental Mobility (Seamoby etc.) | ICMP type used by experimental mobility protocols; no code registration. (IANA) |
| 42 | 0 | Extended Echo Request | RFC8335 “PROBE”: Extended version of classic ping; diagnostic query via interface/proxy. (IANA) |
| 42 | 1-255 | Extended Echo Request (Unassigned) | This code range not assigned. (IANA) |
| 43 | 0 | Extended Echo Reply: No Error | “No error” response to Extended Echo request. (IANA) |
| 43 | 1 | Extended Echo Reply: Malformed Query | Query corrupted/incorrect format. (IANA) |
| 43 | 2 | Extended Echo Reply: No Such Interface | Requested interface not found. (IANA) |
| 43 | 3 | Extended Echo Reply: No Such Table Entry | Queried table entry doesn’t exist. (IANA) |
| 43 | 4 | Extended Echo Reply: Multiple Interfaces Match | Multiple interfaces match query (ambiguous match). (IANA) |
| 43 | 5-255 | Extended Echo Reply (Unassigned) | This code range not assigned. (IANA) |
| 44-252 | - | Unassigned | This type range not assigned in IANA. (IANA) |
| 253 | - | Experiment 1 (RFC3692-style) | Type reserved for experimental use. (IANA) |
| 254 | - | Experiment 2 (RFC3692-style) | Type reserved for experimental use. (IANA) |
| 255 | - | Reserved | Reserved; not used. (IANA) |
Important ICMP Message Types #
Type 0/8: Echo Reply / Echo Request (PING) #
Type 8: Echo Request (Sending ping)
Type 0: Echo Reply (Pong response)

Usage: Checking if host is alive
Type 3: Destination Unreachable #
Code 0: Network Unreachable (Can't reach network)
Code 1: Host Unreachable (Can't reach host)
Code 2: Protocol Unreachable (Protocol not supported)
Code 3: Port Unreachable (Port closed)
Code 4: Fragmentation Needed (Packet too large, fragmentation needed)
Example Scenario:
$ curl http://192.168.1.250:8080
# Router responds:
ICMP Type 3, Code 1: Host Unreachable
# Result: Host doesn't exist on network or is down
Type 11: Time Exceeded #
Code 0: TTL Exceeded in Transit (Foundation of Traceroute!)
Code 1: Fragment Reassembly Time Exceeded
TTL (Time To Live) Mechanism:
Packet sent: TTL=64
Each time passing through router: TTL-1
When TTL=0: Returns ICMP Time Exceeded

This way packets don't loop forever!
Type 5: Redirect #
"There's a better route!" message
Router suggesting routing optimization to host
Type 30: Traceroute #
Used for modern traceroute implementations.
Security Aspect of ICMP #
Potential Threats:
- ICMP Flood (Smurf Attack)
Attacker → Ping to broadcast IP (fake source IP: victim)
All hosts on network → Ping reply to victim
Result: DDoS
ICMP Redirect Attacks Redirecting traffic with fake redirect messages
Ping of Death Buffer overflow by sending excessively large ICMP packets
Protection Methods:
- ICMP rate limiting
- Blocking unnecessary ICMP types in firewall
- Disabling ICMP redirect messages
# Disabling ICMP redirect on Linux
sudo sysctl -w net.ipv4.conf.all.accept_redirects=0
sudo sysctl -w net.ipv4.conf.all.send_redirects=0
Ping Command: The Heart of Network Diagnostics #
What is Ping? #
Ping is a network diagnostic tool that uses the ICMP Echo Request/Reply mechanism. Its name comes from the “ping” sound of submarine sonar - it sends a signal and listens for the echo.
Developer: Mike Muuss (1983) - BBN Technologies
How Does Ping Work? #
┌─────────────┐                           ┌─────────────┐
│   Source    │                           │   Target    │
│   (Your     │                           │  (example.  │
│  Computer)  │                           │    com)     │
└──────┬──────┘                           └──────┬──────┘
       │                                         │
       │ ICMP Echo Request (Type 8)              │
       │ Seq=1, ID=12345, Payload=56 bytes       │
       │                                         │
       │────────────────────────────────────────>│
       │                                         │
       │         ICMP Echo Reply (Type 0)        │
       │         Seq=1, ID=12345                 │
       │                                         │
       │<────────────────────────────────────────│
       │                                         │
       │ ICMP Echo Request (Type 8)              │
       │ Seq=2, ID=12345                         │
       │                                         │
       │────────────────────────────────────────>│
       │                                         │
Step by Step:
- Ping converts target hostname to IP via DNS
- Creates ICMP Echo Request packet (Type 8)
- Adds sequence number and timestamp to packet
- Sends packet to target
- Target responds with Echo Reply (Type 0)
- Ping calculates round-trip time (RTT)
- Shows statistics
Basic Ping Usage #
Simplest Usage #
$ ping google.com

PING google.com (172.217.169.46) 56(84) bytes of data.
64 bytes from sof02s42-in-f14.1e100.net (172.217.169.46): icmp_seq=1 ttl=117 time=15.2 ms
64 bytes from sof02s42-in-f14.1e100.net (172.217.169.46): icmp_seq=2 ttl=117 time=14.8 ms
64 bytes from sof02s42-in-f14.1e100.net (172.217.169.46): icmp_seq=3 ttl=117 time=15.1 ms
^C
--- google.com ping statistics ---
3 packets transmitted, 3 received, 0% packet loss, time 2003ms
rtt min/avg/max/mdev = 14.800/15.033/15.200/0.172 ms
| Operating System | Command | Behavior and Notes |
|---|---|---|
| Linux | ping google.com | Runs infinitely. You need to press Ctrl + C to stop it. (The example output belongs to this behavior). |
| macOS | ping google.com | Runs infinitely. Same as Linux. Use Ctrl + C to stop. |
| Windows | ping google.com | Only sends 4 packets and stops automatically. |
| Windows (Infinite) | ping -t google.com | Add -t parameter to send continuously like Linux/Mac. Use Ctrl + C to stop. |
Output Analysis:
| Field | Description |
|---|---|
64 bytes | ICMP packet size (excluding IP header) |
icmp_seq=1 | Sequence number (for packet loss detection) |
ttl=117 | Time To Live - how many more routers can it pass through |
time=15.2 ms | Round-Trip Time |
Did you know?
ping 8.8.8.8 to ping Google. But to understand if the problem is with your modem or your service provider, you should first do ping 192.168.1.1 (modem gateway). If there’s a problem in the first step, the issue is inside your home :)Statistics Analysis:
3 packets transmitted, 3 received: All packets returned = 0% lossrtt min/avg/max/mdev: Minimum/Average/Maximum/Standard deviationmdev (mean deviation): Shows latency consistency
Ping Parameters and Usage Examples #
1. Limiting Packet Count (-c / –count) #
# Send only 5 packets
$ ping -c 5 cloudflare.com

# On Windows
C:\> ping -n 5 cloudflare.com
2. Changing Packet Interval (-i / –interval) #
# Send ping every 2 seconds (default is 1 second)
$ ping -i 2 google.com

# Fast ping (0.2 second) - requires root
$ sudo ping -i 0.2 google.com

# On Windows (milliseconds)
C:\> ping -w 2000 google.com
Usage Scenario: Long-term monitoring without creating network load
3. Changing Packet Size (-s / –size) #
# Send 1000 byte data (total packet: 1000 + 8 ICMP + 20 IP = 1028 bytes)
$ ping -s 1000 google.com

# Large packet for MTU test
$ ping -s 1472 -M do google.com
# -M do: Sets "Don't Fragment" flag
# If packet is too large, you'll get "Message too long" error
MTU Discovery Example:
# Ethernet MTU is usually 1500 bytes
# Maximum data for ICMP: 1500 - 20 (IP) - 8 (ICMP) = 1472

$ ping -s 1472 -M do google.com  # Passes
$ ping -s 1473 -M do google.com  # Fragmentation needed error
4. Setting TTL Value (-t / -ttl) #
# Send with TTL=5
$ ping -t 5 google.com

# Result: You'll probably get "Time to live exceeded"
# Because 5 hops aren't enough
Traceroute Logic: Learning which router it passes through by increasing TTL
$ ping -t 1 google.com  # Response from first router
$ ping -t 2 google.com  # Response from second router
$ ping -t 3 google.com  # Response from third router
5. Flood Ping (-f) - Use Carefully! #
# Send ping as fast as possible (requires root)
$ sudo ping -f google.com

PING google.com (172.217.169.46) 56(84) bytes of data.
....^C
--- google.com ping statistics ---
50000 packets transmitted, 49998 received, 0.004% packet loss
Warning: This can be detected as a DoS attack! Use only in test environments.
6. Timestamp (-D / –timestamp) #
$ ping -D google.com

[1701358421.123456] 64 bytes from lhr25s34-in-f14.1e100.net: icmp_seq=1 ttl=117 time=15.2 ms
[1701358422.234567] 64 bytes from lhr25s34-in-f14.1e100.net: icmp_seq=2 ttl=117 time=14.9 ms
Usage: Log analysis and detecting time-related issues
7. Specifying Source Address (-I / –interface) #
# Send ping from specific network interface
$ ping -I eth0 google.com

# Or specify source IP
$ ping -I 192.168.1.100 google.com
Scenario: Systems with multiple network interfaces (e.g., VPN + normal connection)
8. IPv6 Ping #
# Ping IPv6 address
$ ping6 google.com
# or
$ ping -6 google.com

PING google.com(lhr25s35-in-x0e.1e100.net (2a00:1450:4009:81a::200e)) 56 data bytes
64 bytes from lhr25s35-in-x0e.1e100.net (2a00:1450:4009:81a::200e): icmp_seq=1 ttl=119 time=16.3 ms
9. Quiet Mode and Verbose (-q / -v) #
# Show only summary statistics
$ ping -c 10 -q google.com

--- google.com ping statistics ---
10 packets transmitted, 10 received, 0% packet loss, time 9013ms
rtt min/avg/max/mdev = 14.234/15.123/16.789/0.891 ms

# Detailed output
$ ping -v google.com
10. Timeout Setting (-W / –timeout) #
# Wait 2 seconds for each packet
$ ping -W 2 -c 3 192.168.1.99

# If host doesn't respond:
PING 192.168.1.99 (192.168.1.99) 56(84) bytes of data.

--- 192.168.1.99 ping statistics ---
3 packets transmitted, 0 received, 100% packet loss, time 6000ms
Real World Ping Examples and Analysis #
Example 1: Healthy Connection #
$ ping -c 5 google.com

PING google.com (142.250.185.46) 56(84) bytes of data.
64 bytes from lhr25s35-in-f14.1e100.net: icmp_seq=1 ttl=117 time=14.2 ms
64 bytes from lhr25s35-in-f14.1e100.net: icmp_seq=2 ttl=117 time=13.9 ms
64 bytes from lhr25s35-in-f14.1e100.net: icmp_seq=3 ttl=117 time=14.1 ms
64 bytes from lhr25s35-in-f14.1e100.net: icmp_seq=4 ttl=117 time=14.3 ms
64 bytes from lhr25s35-in-f14.1e100.net: icmp_seq=5 ttl=117 time=14.0 ms

--- google.com ping statistics ---
5 packets transmitted, 5 received, 0% packet loss, time 4006ms
rtt min/avg/max/mdev = 13.937/14.100/14.318/0.143 ms
Analysis:
✅ 0% packet loss - Perfect
✅ Consistent RTT (~14ms) - Stable connection
✅ Low mdev (0.143ms) - Very little jitter
✅ TTL=117 - Normal (probably started at 128, passed 11 hops)
Result: Healthy internet connection
Example 2: Packet Loss Present #
$ ping -c 10 instable-server.com

PING instable-server.com (203.0.113.45) 56(84) bytes of data.
64 bytes from 203.0.113.45: icmp_seq=1 ttl=54 time=45.2 ms
64 bytes from 203.0.113.45: icmp_seq=3 ttl=54 time=89.7 ms
64 bytes from 203.0.113.45: icmp_seq=5 ttl=54 time=52.3 ms
64 bytes from 203.0.113.45: icmp_seq=7 ttl=54 time=145.2 ms
64 bytes from 203.0.113.45: icmp_seq=10 ttl=54 time=67.8 ms

--- instable-server.com ping statistics ---
10 packets transmitted, 5 received, 50% packet loss, time 9145ms
rtt min/avg/max/mdev = 45.234/80.040/145.234/35.123 ms
Analysis:
❌ 50% packet loss - Serious problem!
❌ High RTT variability (mdev=35.123ms) - Unstable connection
❌ Missing sequence numbers (2,4,6,8,9 lost) - Random packet loss
Possible Causes:
- Network congestion
- Low quality ISP connection
- Wireless signal problems
- Router/firewall under load
Solution Suggestions:
- Ping other servers (is problem isolated?)
- Use MTR to find which hop has the loss
- Contact ISP
🤖 Prompt Guide: Analyze Ping Output with AI
A prompt you can use when sending this ping output to an AI assistant (ChatGPT, Claude etc.):
Analyze the output of this ping command and tell me:

1. What is the connection status? (Healthy/Problematic/Critical)
2. If there's packet loss, what could be the reason?
3. Are RTT (latency) values normal?
4. Is there a jitter (latency variability) problem?
5. What steps should I take?

Ping output:
[Paste ping output here]
Usage Tips:
- Copy the entire ping output (including statistics)
- Add information about your network connection (WiFi/Ethernet/Mobile)
- Mention when the problem started
Example 3: High Latency #
$ ping -c 5 australia-server.com

PING australia-server.com (203.0.113.89) 56(84) bytes of data.
64 bytes from 203.0.113.89: icmp_seq=1 ttl=48 time=287.3 ms
64 bytes from 203.0.113.89: icmp_seq=2 ttl=48 time=289.1 ms
64 bytes from 203.0.113.89: icmp_seq=3 ttl=48 time=288.5 ms
64 bytes from 203.0.113.89: icmp_seq=4 ttl=48 time=287.9 ms
64 bytes from 203.0.113.89: icmp_seq=5 ttl=48 time=288.2 ms

--- australia-server.com ping statistics ---
5 packets transmitted, 5 received, 0% packet loss, time 4007ms
rtt min/avg/max/mdev = 287.345/288.200/289.123/0.643 ms
Analysis:
✅ 0% packet loss - Good
✅ Consistent latency (mdev=0.643ms) - Stable
⚠️ High RTT (~288ms) - Geographic distance
Result: Normal situation - Distance effect from Turkey to Australia
- Speed of light limit: Light travels ~40,000 km in ~133ms
- Routing overhead, processing times etc.
💡 Tip: Calculating Geographic Latency
Quick Calculation Formula:
Distance (km) ÷ 200,000 = Minimum Latency (seconds)

Examples:
- Istanbul → London: 2,500 km → ~12.5 ms (theoretical)
- Istanbul → Tokyo: 9,000 km → ~45 ms (theoretical)
- Istanbul → New York: 8,000 km → ~40 ms (theoretical)
Note: Real latency is usually 2-3 times the theoretical value because:
- Packets don’t go in straight lines (routing)
- Each router adds processing delay
- Fiber optic is ~33% slower than light in vacuum
Example 4: Host Unreachable #
$ ping 192.168.1.250

PING 192.168.1.250 (192.168.1.250) 56(84) bytes of data.
From 192.168.1.1 icmp_seq=1 Destination Host Unreachable
From 192.168.1.1 icmp_seq=2 Destination Host Unreachable
From 192.168.1.1 icmp_seq=3 Destination Host Unreachable
^C
--- 192.168.1.250 ping statistics ---
3 packets transmitted, 0 received, +3 errors, 100% packet loss, time 2048ms
Analysis:
❌ Gateway (192.168.1.1) returning “Destination Host Unreachable”
❌ 100% packet loss
Possible Causes:
- Host is down
- Wrong IP address
- Host is on different subnet
- Firewall completely blocking ICMP
Example 5: Request Timeout (Firewall) #
$ ping 8.8.8.8

PING 8.8.8.8 (8.8.8.8) 56(84) bytes of data.
(silence... no response)
^C
--- 8.8.8.8 ping statistics ---
5 packets transmitted, 0 received, 100% packet loss, time 4096ms
Analysis:
❌ No response at all (not even ICMP message)
❌ 100% loss but no “Unreachable” message either
Difference: “Unreachable” vs “Timeout”
- Unreachable: Router actively rejecting
- Timeout: Silence - probably firewall dropping
Result: Target or intermediate firewall silently dropping ICMP
Example 6: Fragmentation Problem #
$ ping -s 1500 -M do cloudflare.com

PING cloudflare.com (104.16.132.229) 1500(1528) bytes of data.
ping: local error: message too long, mtu=1500
ping: local error: message too long, mtu=1500
^C
Analysis:
❌ Packet larger than MTU and fragmentation forbidden (-M do flag)
Solution:
# Send in MTU-appropriate size
$ ping -s 1472 -M do cloudflare.com
PING cloudflare.com (104.16.132.229) 1472(1500) bytes of data.
1480 bytes from 104.16.132.229: icmp_seq=1 ttl=58 time=8.23 ms
Troubleshooting Strategy with Ping #
Systematic Approach:
1. Loopback test:
   $ ping 127.0.0.1
   ✓ Is TCP/IP stack working?

2. Local machine:
   $ ping $(hostname -I)
   ✓ Is network interface active?

3. Gateway:
   $ ping 192.168.1.1
   ✓ Can I reach local network?

4. DNS server:
   $ ping 8.8.8.8
   ✓ Do I have internet connection?

5. Domain name:
   $ ping google.com
   ✓ Is DNS resolution working?

6. Target server:
   $ ping target-server.com
   ✓ Is target reachable?
MTR: My Traceroute - Advanced Network Diagnostics Tool #
What is MTR? #
MTR (My TraceRoute) is a powerful combination of ping and traceroute. Developed by Matt Kimball, it monitors the network path and performance at each hop in real-time.
MTR is also known as “Matt’s TraceRoute”.
MTR vs Ping vs Traceroute #
| Feature | Ping | Traceroute | MTR |
|---|---|---|---|
| Target testing | ✅ | ❌ | ✅ |
| Path display | ❌ | ✅ | ✅ |
| Per-hop statistics | ❌ | ❌ | ✅ |
| Real-time | ✅ | ❌ | ✅ |
| Packet loss analysis | ✅ | ❌ | ✅ |
| Interactive | ❌ | ❌ | ✅ |
How Does MTR Work? #
MTR combines traceroute’s TTL trick with ping’s continuous monitoring capability:
1. Send ICMP/UDP packet with TTL=1
   → First router returns "Time Exceeded"
   → First hop determined

2. Send packet with TTL=2
   → Second router returns "Time Exceeded"
   → Second hop determined

3. ... Continues this way

4. Continuously pings each hop
   → Calculates packet loss, latency, jitter
   → Updates real-time statistics
MTR Installation #
sudo apt-get install mtr
sudo yum install mtr
brew install mtr
Basic MTR Usage #
Simple Usage #
$ mtr google.com

# Or report mode
$ mtr --report --report-cycles 10 google.com
Interactive Interface:
                             My traceroute  [v0.95]
localhost (192.168.1.100)                          2024-11-25T10:30:45+0000
Keys:  Help   Display mode   Restart statistics   Order of fields   quit
                                       Packets               Pings
 Host                                Loss%   Snt   Last   Avg  Best  Wrst StDev
 1. _gateway (192.168.1.1)            0.0%    10    1.2   1.3   1.1   1.8   0.2
 2. 10.20.30.1                        0.0%    10    8.4   9.1   7.9  12.3   1.4
 3. 81.213.147.1                      0.0%    10   12.3  13.2  11.8  16.7   1.6
 4. 195.175.193.141                   0.0%    10   14.5  15.1  13.9  18.2   1.3
 5. 72.14.223.66                      0.0%    10   15.2  16.0  14.8  19.1   1.5
 6. 108.170.252.193                   0.0%    10   15.8  16.5  15.1  19.8   1.6
 7. 142.251.226.67                    0.0%    10   16.1  16.8  15.4  20.2   1.7
 8. lhr25s35-in-f14.1e100.net         0.0%    10   15.9  16.4  15.2  19.5   1.4
Column Descriptions:
| Column | Description |
|---|---|
| Host | Router/host at each hop (IP + hostname) |
| Loss% | Packet loss percentage at that hop |
| Snt | Total number of packets sent |
| Last | Round-trip time of last packet |
| Avg | Average RTT |
| Best | Best (minimum) RTT |
| Wrst | Worst (maximum) RTT |
| StDev | Standard deviation (jitter indicator) |
Simpler reporting
mtr --report -n -c 50 cyclechain.io | grep -v "Start" | awk 'NR==1 {next} {printf "%-20s \t Loss: %-6s \t Ping: %s ms\n", $2, $3, $6}'
TARGET (HOST)                  LOSS       AVERAGE(ms)
???                            100.0      0.0
10.68.131.192                  0.0%       1.4
138.197.249.56                 0.0%       0.6
143.244.192.116                0.0%       0.5
143.244.224.118                0.0%       0.7
143.244.224.115                4.0%       0.4
162.158.84.196                 0.0%       5.3
162.158.84.55                  0.0%       3.4
104.26.6.74                    0.0%       1.1
MTR Parameters #
1. Report Mode (-r / –report) #
# Send 100 packets and generate report
$ mtr --report --report-cycles 100 google.com

Start: 2024-11-25T10:30:45+0000
HOST: localhost                   Loss%   Snt   Last   Avg  Best  Wrst StDev
  1.|-- _gateway                   0.0%   100    1.2   1.3   1.0   3.2   0.3
  2.|-- 10.20.30.1                 0.0%   100    8.5   9.2   7.8  15.6   1.5
  3.|-- 81.213.147.1               0.0%   100   12.4  13.3  11.7  22.1   2.1
  4.|-- 195.175.193.141            0.0%   100   14.6  15.2  13.8  24.5   2.3
  5.|-- 72.14.223.66               1.0%   100   15.3  16.1  14.7  28.9   2.8
  6.|-- 108.170.252.193            0.0%   100   15.9  16.6  15.0  26.7   2.4
  7.|-- 142.251.226.67             0.0%   100   16.2  16.9  15.3  29.3   2.9
  8.|-- lhr25s35-in-f14.1e100.net  0.0%   100   16.0  16.5  15.1  27.8   2.6
Usage: Use in scripts, log analysis
2. Interval Setting (-i / –interval) #
# Send packet every 5 seconds (default 1 second)
$ mtr -i 5 google.com

# Fast mode: 0.1 second (requires root)
$ sudo mtr -i 0.1 google.com
3. Packet Size (-s / –psize) #
# Send 1000 byte packets
$ mtr -s 1000 google.com
4. IP Version Selection (-4 / -6) #
# Force IPv4
$ mtr -4 google.com

# Force IPv6
$ mtr -6 google.com
5. Using TCP or UDP (-T / -u) #
# Use TCP (default is ICMP)
$ mtr -T -P 80 google.com
# -P: Port number

# Use UDP
$ mtr -u google.com
Why TCP/UDP?
- Some firewalls block ICMP
- TCP/UDP packets better simulate real application traffic
6. Maximum Hop Count (-m / –max-ttl) #
# Check maximum 20 hops (default 30)
$ mtr -m 20 google.com
7. Disable Hostname Resolution (-n / –no-dns) #
# Don't do DNS lookup, show only IP (faster)
$ mtr -n google.com

HOST: localhost                   Loss%   Snt   Last   Avg  Best  Wrst StDev
  1.|-- 192.168.1.1                0.0%    10    1.2   1.3   1.1   1.8   0.2
  2.|-- 10.20.30.1                 0.0%    10    8.4   9.1   7.9  12.3   1.4
  3.|-- 81.213.147.1               0.0%    10   12.3  13.2  11.8  16.7   1.6
8. Show AS Number (-z / –aslookup) #
# Show AS (Autonomous System) number of each hop
$ mtr -z google.com

HOST: localhost                   Loss%   Snt   Last   Avg  Best  Wrst StDev
  1.|-- _gateway                   0.0%    10    1.2   1.3   1.1   1.8   0.2
  2.|-- AS15897 10.20.30.1         0.0%    10    8.4   9.1   7.9  12.3   1.4
  3.|-- AS15897 81.213.147.1       0.0%    10   12.3  13.2  11.8  16.7   1.6
  4.|-- AS15169 195.175.193.141    0.0%    10   14.5  15.1  13.9  18.2   1.3
AS Number: Each ISP/organization’s unique internet routing number
9. CSV/JSON/XML Output #
# CSV format
$ mtr --csv --report -c 10 google.com

# JSON format
$ mtr --json --report -c 10 google.com

# XML format
$ mtr --xml --report -c 10 google.com
10. Interactive Mode Shortcuts #
h - Help
d - Change display mode
r - Restart statistics
p - Pause/Unpause
q - Quit
Real World MTR Examples and Analysis #
Example 1: Healthy Connection #
$ mtr --report -c 50 cloudflare.com

Start: 2024-11-25T11:00:00+0000
HOST: localhost                          Loss%   Snt   Last   Avg  Best  Wrst StDev
  1.|-- _gateway (192.168.1.1)            0.0%    50    1.1   1.2   0.9   2.1   0.2
  2.|-- 10.20.30.1                        0.0%    50    7.8   8.3   7.2  11.2   0.9
  3.|-- 81.213.147.1                      0.0%    50   11.5  12.1  10.8  15.3   1.1
  4.|-- 195.175.193.141                   0.0%    50   13.2  13.8  12.5  17.8   1.2
  5.|-- 104.16.132.229                    0.0%    50    7.8   8.2   7.1  11.5   1.0
Analysis:
✅ 0% loss at all hops
✅ Low and consistent latency
✅ Low StDev (no jitter)
✅ Straight performance line
Result: Excellent connection quality
Example 2: Problem at Specific Hop #
$ mtr --report -c 100 problematic-site.com

HOST: localhost                          Loss%   Snt   Last   Avg  Best  Wrst StDev
  1.|-- _gateway                           0.0%   100    1.2   1.3   1.0   2.5   0.2
  2.|-- 10.20.30.1                         0.0%   100    8.4   8.9   7.8  12.1   0.9
  3.|-- 81.213.147.1                      15.0%   100   45.3  52.1  12.3 198.7  34.2
  4.|-- 195.175.193.141                   14.0%   100   56.7  63.4  14.2 215.3  38.9
  5.|-- 203.0.113.1                       13.0%   100   58.9  65.1  15.1 218.9  39.1
  6.|-- target-server.com                 12.0%   100   59.3  65.8  15.5 220.1  39.5
Analysis:
❌ 15% loss starting from 3rd hop
❌ High StDev (34-39ms) - Serious jitter
❌ Very high worst case (198-220ms)
⚠️ Loss rate gradually decreasing (15% → 12%)
Comment:
- 3rd hop is problematic: Probably ISP’s backbone router
- Loss decreasing: Subsequent hops giving low priority to ICMP (ICMP rate limiting)
- Real problem: 3rd hop - Should contact ISP
Important Note: If loss is only at last hop, it’s usually not significant (ICMP rate limiting).
Example 3: Asymmetric Routing #
# From Istanbul to New York
$ mtr --report -c 50 newyork-server.com

HOST: istanbul-host                      Loss%   Snt   Last   Avg  Best  Wrst StDev
  1.|-- _gateway                           0.0%    50    1.1   1.2   0.9   2.0   0.2
  2.|-- turk-telekom-router                0.0%    50    8.3   8.8   7.5  12.1   1.0
  3.|-- istanbul-ix                        0.0%    50   12.1  12.7  11.2  15.8   1.1
  4.|-- frankfurt-de3                      0.0%    50   35.2  36.1  34.5  42.3   2.1
  5.|-- london-lhr                         0.0%    50   48.7  49.5  47.8  56.2   2.5
  6.|-- new-york-ewr                       0.0%    50   95.3  96.8  94.2 108.7   3.8
  7.|-- newyork-server.com                 0.0%    50   97.1  98.5  95.8 110.3   3.9

# From New York to Istanbul (reverse path)
# May use a different route!
Asymmetric Routing: Going and return use different paths
- This is how the internet normally works
- Important to test both directions when troubleshooting
Example 4: ICMP Rate Limiting #
$ mtr --report -c 100 rate-limited.com

HOST: localhost                          Loss%   Snt   Last   Avg  Best  Wrst StDev
  1.|-- _gateway                           0.0%   100    1.2   1.3   1.0   2.1   0.2
  2.|-- isp-router-1                       0.0%   100    8.5   9.0   7.9  12.3   1.0
  3.|-- isp-router-2                      20.0%   100   45.2  52.3  12.1 156.7  28.4
  4.|-- tier1-backbone                    25.0%   100   56.3  63.1  14.5 178.9  32.1
  5.|-- tier1-backbone-2                  30.0%   100   58.7  65.4  15.2 189.3  34.5
  6.|-- target-network                     5.0%   100   60.1  66.8  15.8 195.7  35.2
  7.|-- rate-limited.com                   0.0%   100   61.3  67.5  16.1 198.1  35.8
Analysis:
⚠️ High loss in middle hops (20-30%)
✅ Low loss at destination (0%)
⚠️ High latency but consistent increase
Comment:
- Misleading appearance: Looks like problem at hops 3-5
- Real situation: These routers doing ICMP rate limiting
- Proof: No loss at destination, only at transit points
Correct Approach:
# Test using TCP
$ mtr -T -P 443 rate-limited.com
# Now you'll see the real situation
Example 5: Geographic Latency Pattern #
$ mtr --report -c 50 tokyo-server.jp

HOST: istanbul-host                      Loss%   Snt   Last   Avg  Best  Wrst StDev
  1.|-- _gateway (TR)                      0.0%    50    1.2   1.3   1.0   2.1   0.2
  2.|-- istanbul-ix (TR)                   0.0%    50   12.3  13.1  11.5  16.7   1.2
  3.|-- frankfurt-de (DE)                  0.0%    50   35.7  36.5  34.8  42.1   2.0
  4.|-- moscow-ru (RU)                     0.0%    50   55.3  56.8  54.2  65.7   3.1
  5.|-- novosibirsk-ru (RU)                0.0%    50   88.5  90.2  87.1 102.3   4.2
  6.|-- vladivostok-ru (RU)                0.0%    50  145.7 147.9 143.2 165.8   6.1
  7.|-- seoul-kr (KR)                      0.0%    50  178.3 180.5 175.9 198.7   7.2
  8.|-- tokyo-jp (JP)                      0.0%    50  195.8 198.2 193.4 215.3   7.8
  9.|-- tokyo-server.jp                    0.0%    50  197.3 199.8 195.1 217.9   7.9
Analysis:
✅ 0% packet loss - Healthy
⚠️ High latency - Geographic distance
✅ Regular increase pattern - Normal
Geographic Latency Calculation:
Istanbul → Tokyo: ~9,000 km
Speed of light (in vacuum): 300,000 km/s
Theoretical minimum: 9000/300000 = 0.03s = 30ms

Actual: ~198ms
Extra: 168ms

Why?
- Fiber optic: ~200,000 km/s (slower than vacuum)
- Routing overhead: Doesn't go straight, takes winding path
- Router processing delay: ~1-2ms per hop
- Serialization delay: Packet transmission time
Example 6: Packet Loss Pattern Analysis #
$ mtr --report -c 200 unstable-host.com

HOST: localhost                          Loss%   Snt   Last   Avg  Best  Wrst StDev
  1.|-- _gateway                           0.0%   200    1.2   1.3   1.0   2.5   0.2
  2.|-- isp-router                         0.0%   200    8.4   8.9   7.8  12.5   1.0
  3.|-- regional-hub                       2.0%   200   15.3  16.1  14.2  45.7   5.2
  4.|-- backbone-router                    2.5%   200   28.7  30.2  27.1  98.3   9.8
  5.|-- international-link                15.0%   200   55.3  68.4  52.8 245.7  35.2
  6.|-- destination-network               18.0%   200   67.8  82.3  65.1 287.9  42.1
  7.|-- unstable-host.com                 20.0%   200   72.5  89.7  68.9 312.4  48.7
Detailed Analysis:
- Hops 1-2: Clean (0% loss)
- Hops 3-4: Minimal loss (2-2.5%) - Acceptable
- Hop 5: Sharp loss increase (15%) - ⚠️ Critical point
- Hops 6-7: Continuing loss - Chain effect
Problem Localization:
International Link (hop 5) = Main problem source
- High StDev (35.2ms) → Jitter problem
- 15% loss → Serious congestion
- Worst: 245.7ms → Intermittent spikes
Possible Causes:
- Submarine cable congestion
- Peering point problems
- BGP route flapping
- DDoS attack effect
Advanced MTR Usage #
1. Continuous Monitoring Script #
#!/bin/bash
# mtr-monitor.sh

TARGET="critical-server.com"
THRESHOLD=5  # 5% loss threshold
LOG_FILE="/var/log/mtr-monitor.log"

while true; do
    TIMESTAMP=$(date '+%Y-%m-%d %H:%M:%S')

    # Get MTR report
    REPORT=$(mtr --report -c 20 --no-dns $TARGET)

    # Check packet loss
    LOSS=$(echo "$REPORT" | tail -1 | awk '{print $3}' | tr -d '%')

    if (( $(echo "$LOSS > $THRESHOLD" | bc -l) )); then
        echo "[$TIMESTAMP] ALERT: Packet loss $LOSS% detected!" >> $LOG_FILE
        echo "$REPORT" >> $LOG_FILE

        # Send email/Slack notification
        # mail -s "Network Alert" [email protected] < $LOG_FILE
    fi

    sleep 300  # Check every 5 minutes
done
2. Multiple Target Comparison #
#!/bin/bash
# compare-routes.sh

TARGETS=("google.com" "cloudflare.com" "aws.com" "azure.com")

for target in "${TARGETS[@]}"; do
    echo "=== Testing $target ==="
    mtr --report -c 50 "$target"
    echo ""
done
3. Parsing JSON Output #
$ mtr --json --report -c 10 google.com > mtr-output.json

# Analyze with Python
$ cat << 'EOF' > parse_mtr.py
import json
import sys

with open('mtr-output.json', 'r') as f:
    data = json.load(f)

print("MTR Analysis Report")
print("=" * 50)

for hop in data['report']['hubs']:
    hop_num = hop['count']
    host = hop['host']
    loss = hop['Loss%']
    avg_rtt = hop['Avg']

    print(f"Hop {hop_num}: {host}")
    print(f"  Loss: {loss}%, Avg RTT: {avg_rtt}ms")

    if loss > 5.0:
        print(f"  ⚠️  WARNING: High packet loss!")

    print()
EOF

python3 parse_mtr.py
4. Creating Graphics (mtr + gnuplot) #
# Convert MTR data to CSV
$ mtr --csv --report -c 100 google.com > mtr-data.csv

# Graph with gnuplot
$ cat << 'EOF' > plot.gp
set datafile separator ","
set xlabel "Hop"
set ylabel "Latency (ms)"
set title "Network Latency by Hop"
set grid
set terminal png size 800,600
set output 'mtr-graph.png'

plot 'mtr-data.csv' using 1:5 with linespoints title 'Avg Latency'
EOF

gnuplot plot.gp
Interpreting MTR Output: Best Practices #
1. Interpreting Packet Loss #
Loss Only at Last Hop:
Hops 1-7: 0% loss
Hop 8 (destination): 10% loss
→ Probably insignificant (ICMP rate limiting)
Loss at Middle Hop:
Hops 1-3: 0% loss
Hop 4: 15% loss
Hops 5-8: 15% loss
→ Serious problem - Entire path after hop 4 is affected
Gradually Increasing Loss:
Hop 1: 0%
Hop 2: 5%
Hop 3: 10%
Hop 4: 15%
→ Chain effect - Find first problematic hop
2. Latency Pattern Analysis #
Regular Increase (Normal):
Hop 1:  1ms
Hop 2: 10ms (+9ms)
Hop 3: 20ms (+10ms)
Hop 4: 30ms (+10ms)
→ Each hop adding similar delay - normal
Sudden Jump:
Hop 1:  1ms
Hop 2: 10ms
Hop 3: 150ms (+140ms!)
Hop 4: 160ms (+10ms)
→ Problem at hop 3 - International connection, load etc.
Decreasing Latency (Abnormal):
Hop 1: 50ms
Hop 2: 30ms (???)
Hop 3: 40ms
→ Asymmetric routing or time synchronization issue
3. Jitter (StDev) Evaluation #
StDev < 5ms:   Excellent - Ideal for real-time applications
StDev 5-20ms:  Good - Sufficient for most applications
StDev 20-50ms: Medium - May have issues with VoIP
StDev > 50ms:  Bad - Serious instability
Important for VoIP:
- Jitter > 30ms → Voice quality drops
- Latency > 150ms → Delay is noticeable
- Packet loss > 1% → Voice dropouts
Real World Scenarios and Problem Solving #
Scenario 1: “Internet is Slow” Complaint #
First Step: Basic Tests
# 1. Local network test
$ ping -c 10 192.168.1.1
# Result: Average 1.2ms, 0% loss → Local network OK

# 2. DNS test
$ ping -c 10 8.8.8.8
# Result: Average 85ms, 15% loss → Problem exists!

# 3. Detail with MTR
$ mtr --report -c 50 8.8.8.8
MTR Output:
HOST: laptop                             Loss%   Snt   Last   Avg  Best  Wrst StDev
  1.|-- 192.168.1.1                       0.0%    50    1.2   1.3   1.0   2.1   0.2
  2.|-- 10.50.123.1                      15.0%    50   45.3  52.8  12.5 198.7  35.2
  3.|-- 81.213.x.x                       15.0%    50   56.2  63.4  15.1 215.8  38.1
  4.|-- 8.8.8.8                          15.0%    50   87.5  94.2  80.3 234.5  42.3
Diagnosis:
- Problem starts immediately after gateway (hop 2)
- 15% consistent loss
- High jitter (StDev ~35-42ms)
Solution:
- Restart ISP router
- If doesn’t fix, contact ISP
- Examine logs of ISP device at hop 2
Scenario 2: Website Sometimes Opens, Sometimes Doesn’t #
Test:
# Monitor continuously for 30 minutes
$ mtr --report -c 1800 problematic-website.com
MTR Output (Excerpt):
HOST: laptop                             Loss%   Snt   Last   Avg  Best  Wrst StDev
  1.|-- gateway                            0.0%  1800    1.2   1.3   1.0   2.3   0.2
  2.|-- isp                                0.0%  1800    8.4   8.9   7.8  12.5   0.9
  3.|-- backbone-1                         0.0%  1800   15.3  16.2  14.5  25.7   2.1
  4.|-- backbone-2                         0.0%  1800   28.7  30.1  27.3  45.8   3.2
  5.|-- cdn-edge                           3.5%  1800   35.2  38.7  33.1 456.7  28.9
  6.|-- problematic-website.com            5.0%  1800   37.8  42.3  35.7 489.2  32.1
Observation:
- Intermittent problem at CDN edge (3.5% loss)
- Very high worst-case latency (456-489ms)
- High StDev → Intermittent issue
Analysis:
# Learn AS number of CDN edge
$ mtr -z --report -c 10 problematic-website.com

# Test from different CDN edge (via DNS)
$ dig problematic-website.com +short
203.0.113.50
203.0.113.51
203.0.113.52

$ mtr --report -c 50 203.0.113.51
$ mtr --report -c 50 203.0.113.52
Solution:
- Contact CDN provider
- Use alternative CDN edge
- Temporary solution: Add fixed IP to
/etc/hostsfile
Scenario 3: Poor VoIP Call Quality #
Requirements:
- Latency < 150ms
- Jitter < 30ms
- Packet loss < 1%
Test:
# Test VoIP server
$ mtr --report -c 200 voip.company.com
MTR Output:
HOST: office-pc                          Loss%   Snt   Last   Avg  Best  Wrst StDev
  1.|-- office-gateway                     0.0%   200    0.8   0.9   0.7   1.5   0.1
  2.|-- datacenter-switch                  0.0%   200    2.3   2.5   2.1   4.2   0.3
  3.|-- datacenter-router                  0.0%   200    3.1   3.4   2.9   5.7   0.4
  4.|-- voip.company.com                   0.0%   200    4.2   4.6   4.0   7.8   0.5
Analysis:
- ✅ Latency: 4.6ms average - Excellent
- ✅ Jitter: 0.5ms StDev - Excellent
- ✅ Packet loss: 0% - Excellent
But there’s a problem! Let’s try a different method:
# Test with UDP (VoIP uses UDP)
$ mtr -u --report -c 200 voip.company.com

HOST: office-pc                          Loss%   Snt   Last   Avg  Best  Wrst StDev
  1.|-- office-gateway                     0.0%   200    0.9   1.0   0.8   1.6   0.1
  2.|-- datacenter-switch                  0.5%   200    2.4   2.6   2.2   8.9   0.9
  3.|-- datacenter-router                  1.2%   200    3.2   4.8   3.0  45.7   5.2
  4.|-- voip.company.com                   2.5%   200    4.5   6.3   4.1  67.8   8.7
New Findings:
❌ 2.5% loss with UDP - Threshold exceeded
❌ Jitter: 8.7ms - Still acceptable but increasing
⚠️ May be QoS problem in router
Solution:
- Check QoS (Quality of Service) policies
- Prioritize VoIP traffic
- Examine datacenter router configuration
Scenario 4: Slowdown at Specific Times #
Monitoring Script:
#!/bin/bash
# hourly-mtr.sh

TARGET="critical-app.com"
LOG_DIR="/var/log/mtr-hourly"

mkdir -p $LOG_DIR

while true; do
    TIMESTAMP=$(date '+%Y%m%d-%H%M')
    OUTPUT_FILE="$LOG_DIR/mtr-$TIMESTAMP.txt"

    echo "=== MTR Report: $(date) ===" > $OUTPUT_FILE
    mtr --report -c 100 $TARGET >> $OUTPUT_FILE

    # Loss analysis
    LOSS=$(tail -1 $OUTPUT_FILE | awk '{print $3}' | tr -d '%')
    AVG_RTT=$(tail -1 $OUTPUT_FILE | awk '{print $6}')

    echo "Loss: $LOSS%, Avg RTT: $AVG_RTT ms" >> $OUTPUT_FILE

    sleep 3600  # Every hour
done
Analysis:
# Analyze all logs
$ for file in /var/log/mtr-hourly/*.txt; do
    echo -n "$(basename $file): "
    grep "Loss:" $file
done

mtr-20241125-0800.txt: Loss: 0.0%, Avg RTT: 15.3 ms
mtr-20241125-0900.txt: Loss: 0.5%, Avg RTT: 18.7 ms
mtr-20241125-1000.txt: Loss: 12.0%, Avg RTT: 89.3 ms  # ← Problem!
mtr-20241125-1100.txt: Loss: 15.0%, Avg RTT: 102.7 ms # ← Problem continues
mtr-20241125-1200.txt: Loss: 2.0%, Avg RTT: 22.1 ms
Finding: Serious drop between 10:00-11:00 Possible Cause: Peak hours, backup process, scheduled task
Scenario 5: Multi-Path Routing Detection #
Sometimes packets go through different paths:
# Run MTR 10 times in a row
$ for i in {1..10}; do
    echo "=== Run $i ==="
    mtr --report -c 5 cyclechain.io | grep "cyclechain.io"
    sleep 2
done

=== Run 1 ===
8.|-- cyclechain.io  0.0% 5  45.2  46.1  44.8  48.3  1.2
=== Run 2 ===
9.|-- cyclechain.io  0.0% 5  87.5  88.2  86.9  90.1  1.1  # ← Different!
=== Run 3 ===
8.|-- cyclechain.io  0.0% 5  44.9  45.7  44.1  47.8  1.3
Observation:
- One extra hop in Run 2 (9 vs 8)
- Very different latency (88ms vs 45ms)
Explanation: Load balancing - Different paths being used Is this normal? Yes, it’s a feature of the modern internet!
Advanced Tips and Best Practices #
1. Optimizing ICMP #
Linux Kernel Parameters:
# ICMP rate limiting settings
sudo sysctl -w net.ipv4.icmp_ratelimit=1000
sudo sysctl -w net.ipv4.icmp_ratemask=6168

# ICMP echo ignore (not responding to ping)
sudo sysctl -w net.ipv4.icmp_echo_ignore_all=0  # 0=respond, 1=don't respond

# ICMP echo ignore broadcast
sudo sysctl -w net.ipv4.icmp_echo_ignore_broadcasts=1  # Against Smurf attack
2. Firewall and ICMP #
iptables Rules:
# Completely blocking ICMP (not recommended!)
sudo iptables -A INPUT -p icmp -j DROP

# Block only ping response
sudo iptables -A INPUT -p icmp --icmp-type echo-request -j DROP

# Allow with rate limiting (recommended)
sudo iptables -A INPUT -p icmp --icmp-type echo-request -m limit --limit 1/s -j ACCEPT
sudo iptables -A INPUT -p icmp --icmp-type echo-request -j DROP

# Allow all ICMP types in controlled manner
sudo iptables -A INPUT -p icmp --icmp-type destination-unreachable -j ACCEPT
sudo iptables -A INPUT -p icmp --icmp-type time-exceeded -j ACCEPT
sudo iptables -A INPUT -p icmp --icmp-type echo-request -m limit --limit 5/s -j ACCEPT
3. MTR vs Traceroute #
Traceroute:
$ traceroute google.com

traceroute to google.com (142.250.185.46), 30 hops max, 60 byte packets
 1  _gateway (192.168.1.1)  1.234 ms  1.189 ms  1.156 ms
 2  10.20.30.1 (10.20.30.1)  8.456 ms  8.423 ms  8.389 ms
 3  81.213.147.1 (81.213.147.1)  12.567 ms  12.534 ms  12.501 ms
MTR Advantages:
- Continuous update (real-time)
- Statistical analysis (min/avg/max/StDev)
- Packet loss detection
- Interactive mode
Traceroute Use Case:
- One-time path determination
- When simple output needed in scripts
- Systems where MTR is not available
4. Performance Monitoring Dashboard #
MTR Monitoring with Prometheus + Grafana:
# prometheus-mtr-exporter config
targets:
  - name: google
    host: google.com
    interval: 60s
  - name: cloudflare
    host: cloudflare.com
    interval: 60s

# Visualize in Grafana:
# - Latency timeline
# - Packet loss heatmap
# - Jitter graph
# - Alert rules
5. MTR for Mobile/Remote Work #
Running MTR over SSH:
# Run MTR on server
$ ssh user@remote-server "mtr --report -c 50 google.com"

# Or interactive mode
$ ssh -t user@remote-server "mtr google.com"
Before/After VPN Comparison:
# Without VPN
$ mtr --report -c 50 work-server.com > without-vpn.txt

# With VPN
$ sudo openvpn --config company.ovpn &
$ mtr --report -c 50 work-server.com > with-vpn.txt

# Compare
$ diff without-vpn.txt with-vpn.txt
Conclusion #
In this guide, we’ve examined the ICMP protocol, ping command, and MTR tool in depth, starting from the basics of the internet.
Summary of What We’ve Learned: #
Internet Architecture
- Flexible and resilient thanks to packet switching
- Layered architecture (TCP/IP) provides modularity
- Routing works with distributed intelligence
ICMP Protocol
- Control and error notification layer of IP
- Foundation of tools like ping and traceroute
- Should be used in controlled manner for security
Ping Command
- Simple but powerful diagnostic tool
- Reachability, latency and loss detection
- First step of systematic troubleshooting
MTR Tool
- Advanced version of ping + traceroute
- Real-time, statistical analysis
- Very effective in localizing network problems
Mastering Yoda & Resources: #
RFC Documents:
- RFC 791: Internet Protocol (IP)
- RFC 792: Internet Control Message Protocol (ICMP)
- RFC 2151: A Primer On Internet and TCP/IP Tools and Utilities
- RFC 4443: Internet Control Message Protocol (ICMPv6)
Books:
- “TCP/IP Illustrated, Volume 1” - W. Richard Stevens
- “Computer Networks” - Andrew S. Tanenbaum
- “The TCP/IP Guide” - Charles M. Kozierok
Online Tools:
- https://mtr.sh - Web-based MTR
- https://www.subnet-calculator.com - IP calculation
- https://bgp.he.net - BGP routing information
- https://ping.pe - Global Ping & MTR (Colored block visualization)
- https://www.uptrends.com/tools/traceroute - Map-based Visual Traceroute
- https://maplatency.com - Visual Ping Heat Map (Heatmap)
- https://toolbox.googleapps.com/apps/dig - Google Admin Dig & Trace
- https://tools.keycdn.com/traceroute - Geo-Location Traceroute
- https://radar.cloudflare.com - Cloudflare Radar (Traffic Map)
- https://lg.ring.nlnog.net - Multi-Location Looking Glass (Command line outputs)
- https://threatmap.fortiguard.com - Live Cyber Threat Map (Visual)
Final Word #
The Internet is one of the most complex and impressive engineering achievements in human history. Therefore, the tools we examined are the most basic ways to check the health of this massive structure and diagnose problems.
Pinging is not just sending a packet and waiting for a response; it’s being part of the network that connects billions of people together. Every ICMP Echo Request is a small ambassador that embarks on a journey through the nervous system of the internet.
When you monitor your network with MTR, you’re actually observing the data flow over fiber optic cables stretching around the world, giant data centers, and countless routers.
Last updated: November 25, 2024 Author: Fatih Mert Doğancan License: Creative Commons BY-SA 4.0
Series
Internet
- Part 1 2025-11-26
Deep Dive into the Internet: The Anatomy of Network Diagnostics with ICMP, Ping, and MTR